
Feb 8, 2024
Integrate A/B testing results into Google Analytics 4
Instructions to tracking experiments with Google Analytics 4
Optimal UX provides robust analytics with Machine Learning and insights extraction. However, you can still use Google Analytics 4 to compare the behavior of your experiment participants.
Below is the short video about how to set up an audience for your experiment:
Enable integration with GA4
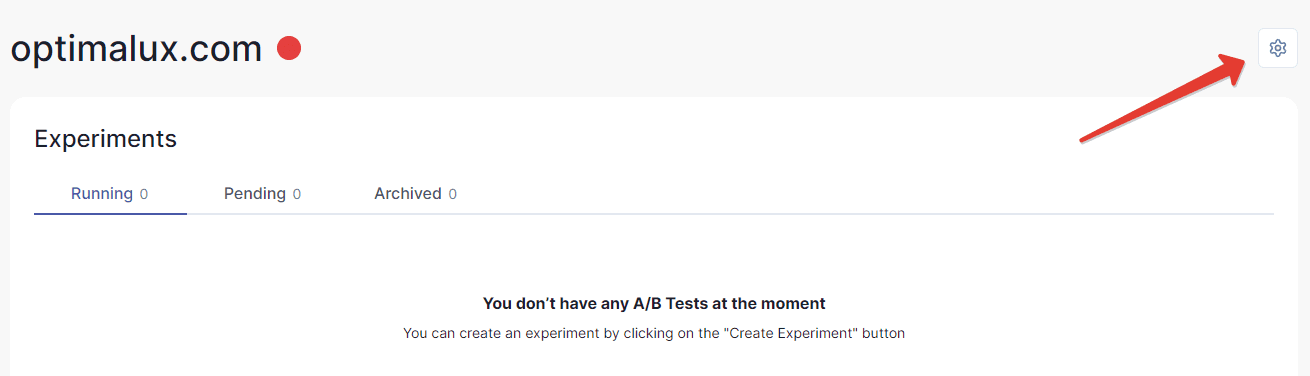
Go to your website settings by clicking the gear icon in the top right corner:
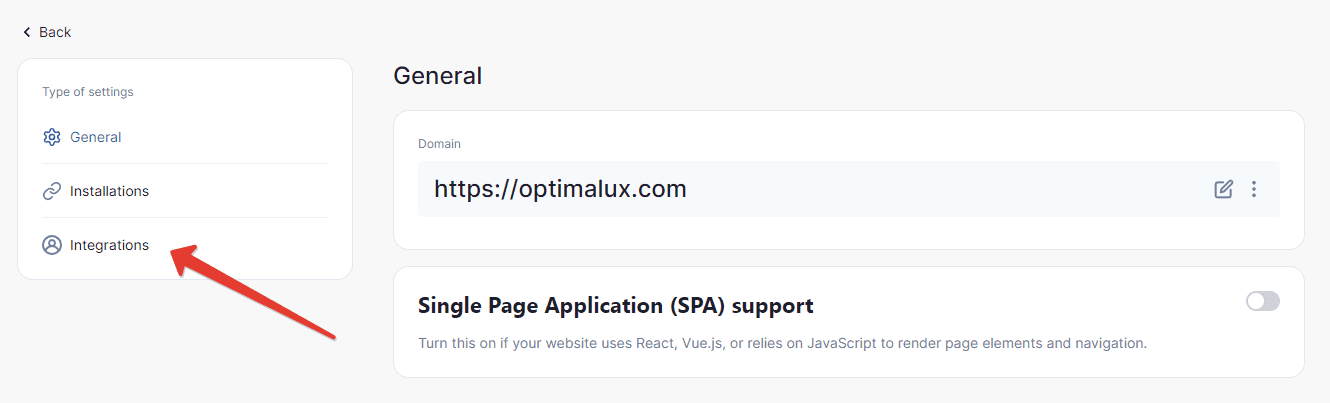
2. Select “Integrations” in the left-side menu:
3. Turn on “Google Analytics 4”
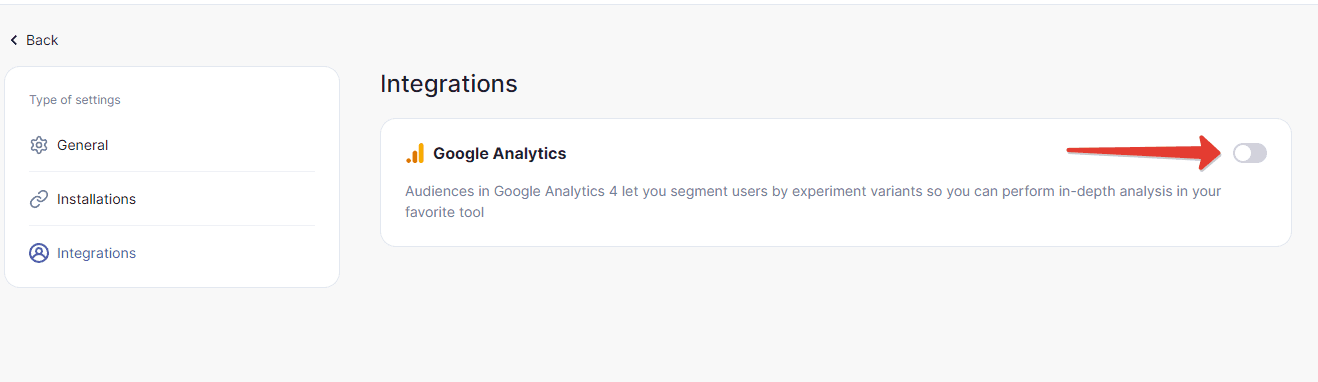
4. Now your experiment data will be also sent to Google Analytics 4 if it is enabled on a web page.
5. (Optional) For your convenience Optimal UX can automatically create audiences whenever a new experiment is launched. Click “Authorize” and follow instructions to connect your site to Google Analytics property.
It is recommended to configure automatic audience creation.
Configuring experiment audiences
To distinguish between experiment variants in Google Analytics 4 you need to create audiences there - one per each variant. Every time you launch an experiment, the system will generate unique identifier for each variant that needs to be copied into Google Analytics.
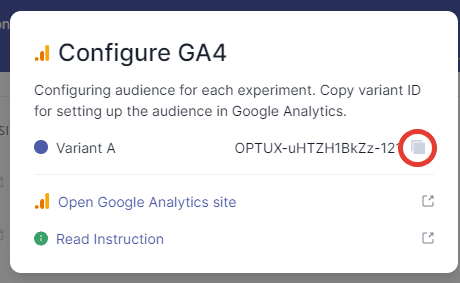
Click “Configure GA4” on the Analytics page

Copy the ID code of your first Variant. You will need this code later.
Well done! Now proceed to your Google Analytics account.
Set up Google Analytics 4 to track your experiments
Log into your Google Analytics account. Note: You need to have Admin access to the account.
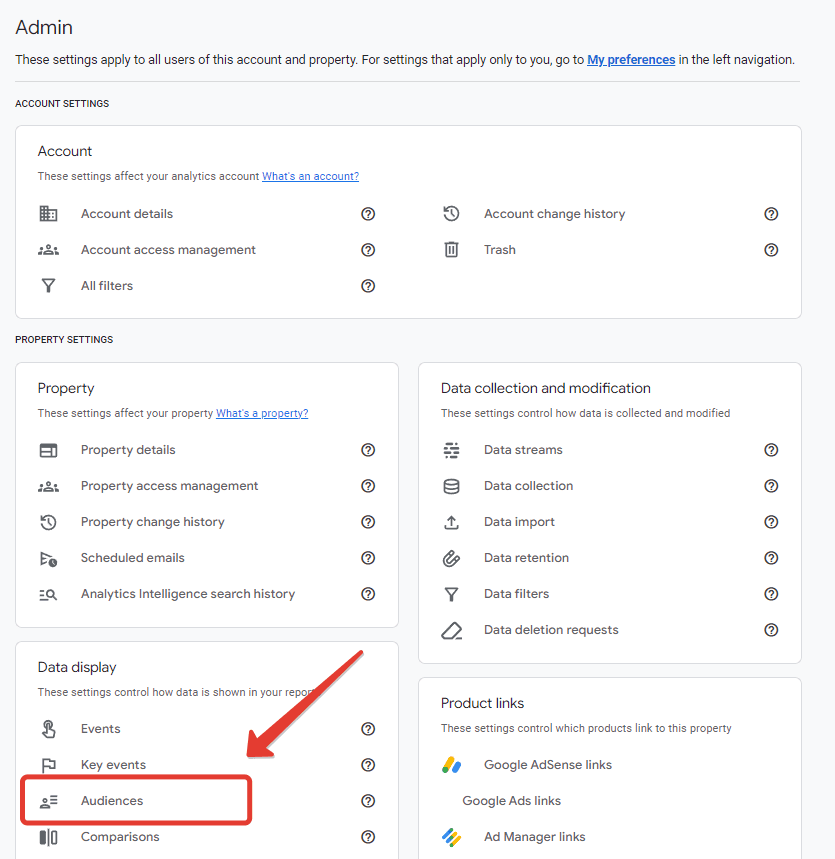
Hover over the left sidebar and click on the “Admin” section in the bottom left corner.
Scroll down to the “Data Display” section and click on “Audiences”
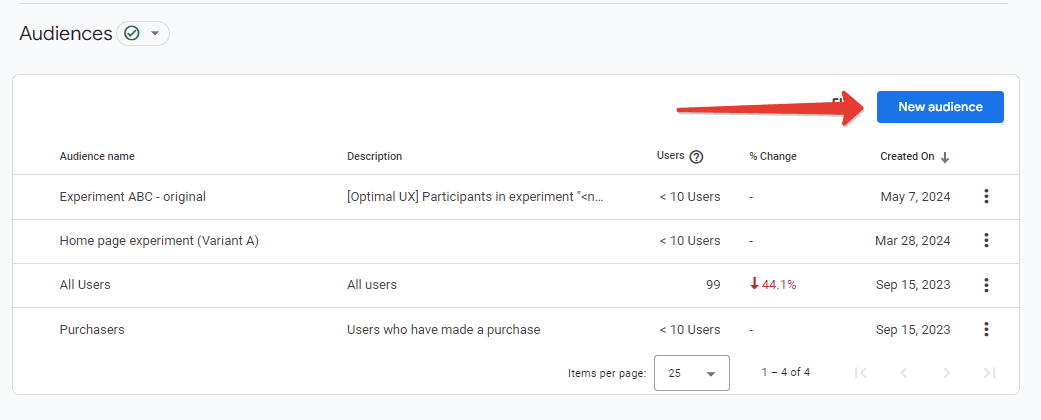
Click on “New audience” in the top right corner. Note: You have to create a unique audience for each variant in your experiment.
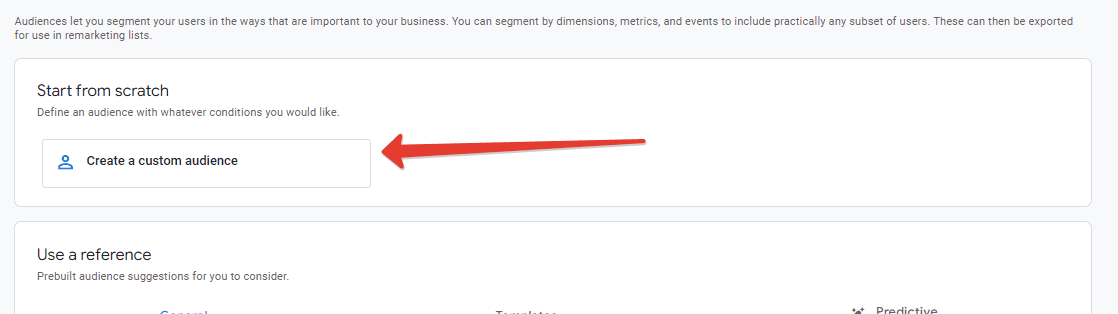
Select “Create a custom audience”
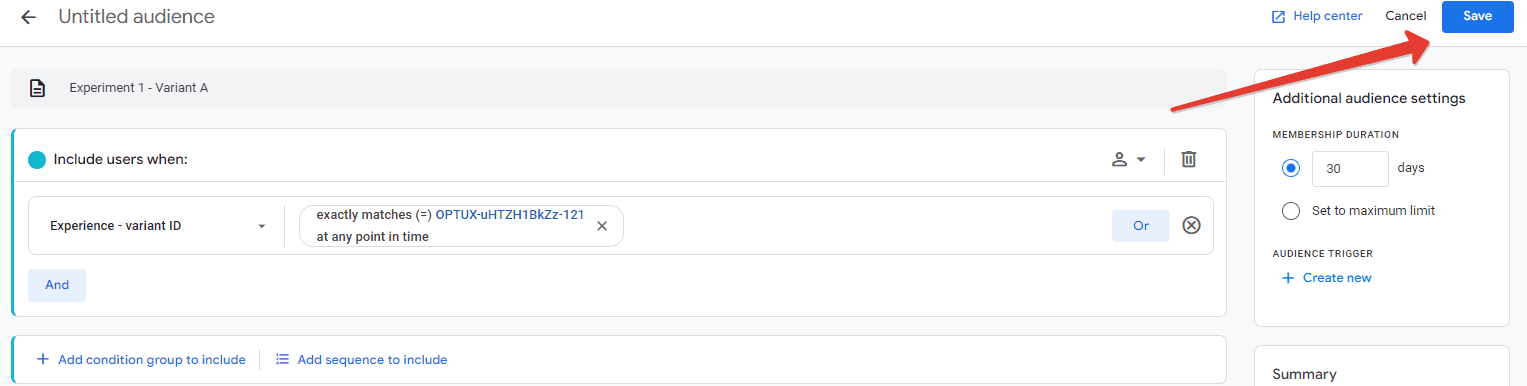
Give your audience a meaningful name, e.g. “Experiment name — Variant letter”
Click on “Add new condition” and select “General”, and then “Experience - variant ID”
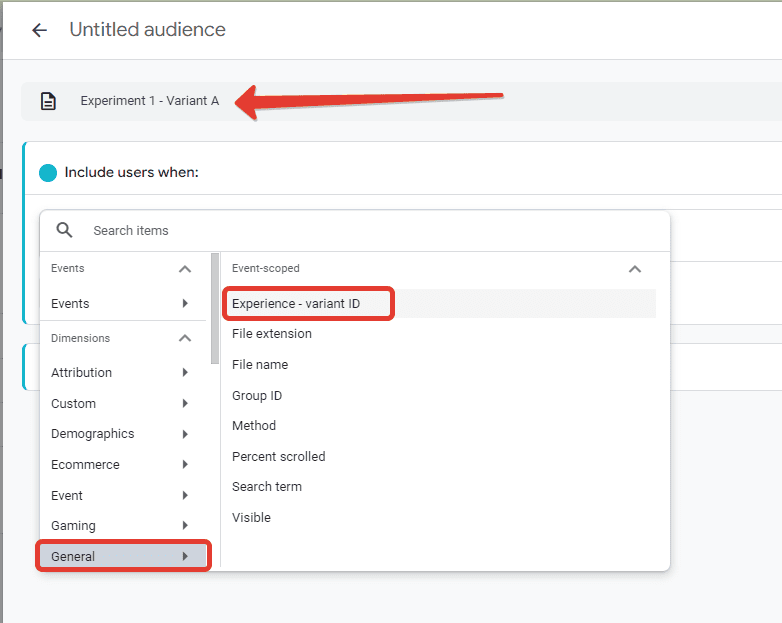
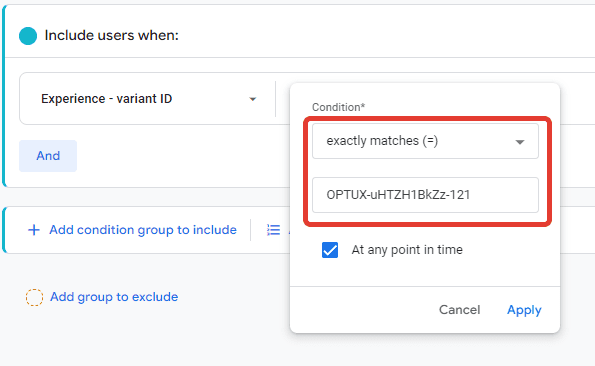
Click on “Add filter”, select “exactly matches (=)” and enter the Variant ID you have copied from OptimalUX app.
Click “Save” in the upper right corner:
That’s it! Remember, you have to create a unique audience for each variant in your experiment.
View your experiments in Google Analytics 4!
Other integrations
Read more:
How to Analyze A/B Test Results in LogRocket with Optimal UX Integration
Track A/B tests in LogRocket using secure experiment tracking. Watch session replays, monitor performance, and debug issues across variants with comprehensive analytics.
Feb 5, 2025
📁 A/B testing
📁 Split testing
📁 Integration
📁 Client-side testing
📁 Client-side testing
How to Analyze A/B Test Results in Mixpanel with Optimal UX Integration
Track experiment data in Mixpanel using events and user properties. Learn how to analyze A/B test results using cohorts, funnels, and advanced analytics features.
Jan 31, 2025
📁 A/B testing
📁 Split testing
📁 Integration
📁 Client-side testing
📁 Client-side testing
How to Analyze A/B Test Results in Matomo Analytics with Optimal UX Integration
Track A/B tests in Matomo Analytics using native experiment events. Analyze results while maintaining full control over your testing data.
Feb 3, 2025
📁 A/B testing
📁 Split testing
📁 Integration
📁 Client-side testing
📁 Client-side testing
How to Analyze A/B Test Results in Hotjar with Optimal UX Integration
Track experiment participation in Hotjar using custom events. Get visual insights into user behavior across variants through heatmaps and session recordings.
Feb 7, 2025
📁 A/B testing
📁 Split testing
📁 Integration
📁 Client-side testing
📁 Client-side testing